
Now that the 2016 election results are available by town for New Hampshire, I thought I would take a look at where libertarian candidates tended to do well or poorly, and how that pattern compared with conservative versus progressive support by town.
To measure libertarian voting by town, I used different variables in different years.
For 2008, I used:
- Ron Paul vote share in the Republican presidential primary,
- Libertarian Party vote share in the general presidential election (both Bob Barr and George Phillies had separate Libertarian candidacies in New Hampshire that year),
- Libertarian Party vote share in the general gubernatorial election.
For 2012, I used:
- Ron Paul vote share in the Republican presidential primary,
- Libertarian Party and Ron Paul write-in vote share in the general presidential election,
- Andrew Hemingway vote share in the Republican gubernatorial primary of 2014. (So this is sort of a 2012-4 measure really.)
For 2016, I used:
- Rand Paul vote share in the Republican presidential primary (he had dropped out of the race, but over 1% of voters voted for him anyway),
- Frank Edelblut vote share in the Republican gubernatorial primary,
- Libertarian Party vote share in the general presidential election,
- Libertarian Party and Aaron Day vote share in the general U.S. Senate election.
I also calculated conservatism vs. progressivism by town for 2012 and 2016.
For 2012 conservative voting, I used:
- Republican Party general presidential election vote share,
- Republican Party general gubernatorial election vote share (2012),
- Republican Party general gubernatorial election vote share (2014).
For 2016 conservative voting, I used:
- Republican Party general presidential election vote share,
- Republican Party and Aaron Day vote share in the general U.S. Senate election,
- Republican Party general gubernatorial election vote share.
I also looked at how these variables correlated with each other. The strongest correlations I found outside the Republican candidates’ correlations with each other were between LP + Day Senate 2016 vote share and Ron Paul 2012 primary vote share (r=0.51), LP + Day Senate 2016 vote share and Trump vote share (r=0.37), Rand 2016 and Ron 2012 primary vote share (r=0.32), LP + Day Senate 2016 vote share and Edelblut ’16 vote share (r=0.30), Johnson ’12 + Ron Paul write-ins and Ron Paul 2012 primary vote share (r=0.51), Trump vote share and Ron Paul 2012 primary vote share (r=0.45), Paul ’12 and Paul ’08 vote share (r=0.49), Paul ’08 and Hemingway ’14 vote share (r=0.43), and Paul ’12 and Hemingway ’14 vote share (r=0.34). Interestingly, the Johnson-Weld ticket really didn’t correlate with anything else at all, suggesting that most of their voters were simply anti-Clinton and anti-Trump, not libertarian leaners. Most of those voters probably won’t stick around for future Libertarian candidacies unless they don’t have a lot of options.
These correlations also imply that a lot of Ron Paul’s 2012 primary vote came from disaffected, non-conservative, potentially populist or nationalist Republicans. This is consistent with what I reported here on Pileus years ago about how Ron Paul in 2012 added a bunch of anti-establishment, moderate to liberal independents and Republicans to his libertarian base. It also suggests, perhaps, some reason for optimism about the Trump phenomenon. A lot of his voters are simply alienated and not that strongly ideological. If they could vote for both Ron Paul in 2012 and Donald Trump in 2016, these people must be ideologically flexible, even if consistently anti-establishment.
So where can you find libertarians, progressives, and conservatives in New Hampshire? These maps tell the tale. (Unincorporated townships and towns with fewer than 100 votes are not mapped.)

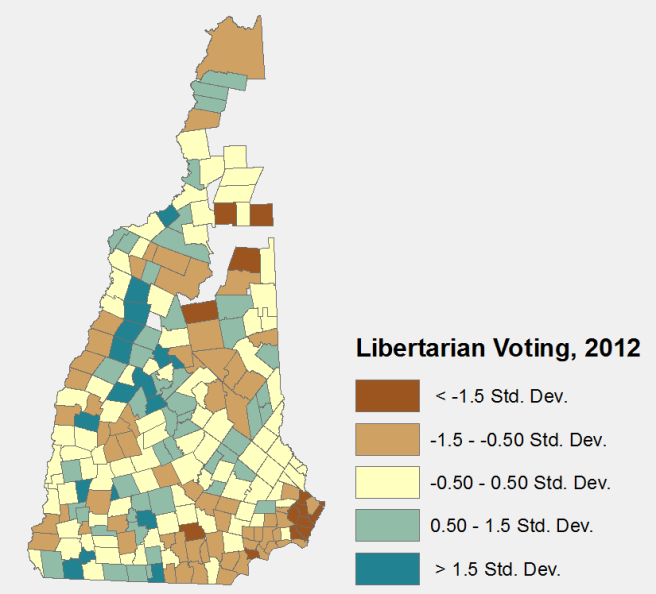


Please note that each variable is recentered each year, so that it is impossible to compare towns across years in any absolute sense (“this town is becoming more libertarian” is an inference you absolutely cannot make from these data), though you could make comparisons over time, relative to the average town in New Hampshire (“this town used to be quite a bit more libertarian than other towns, but now it’s only average” is something you could say based on these data). The recentering has to be done because different candidates run and are included in the calculations in different years.
Now then, where are the libertarians? The results aren’t greatly different from those I’ve reported before, with New Hampshire’s most libertarian towns generally lying in the Appalachian mountains and foothills of the western part of the state. However, in 2016 there is a notable change, with the libertarian center of gravity shifting southward to Cheshire and western Hillsborough counties. This surprised me a bit at first, but it makes sense once you consider that conservatarian Republican gubernatorial candidate Frank Edelblut is from western Hillsborough County and absolutely dominated the vote in his hometown and nearby towns, coming close to knocking off then-presumptive nominee Chris Sununu (now governor elect) statewide.
Republicans, meanwhile, are much stronger in the southeastern third of the state than elsewhere in 2012, but in 2016 they had more even support throughout the state, making clear inroads into the relatively deprived North Country. This is consistent with the general shift of the party to the nationalist radical right with accompanying loss of support among upscale groups and growth among the white working class.
Scatter plots make these phenomena clearer (click to expand).


The last scatter plot, in particular, shows that between 2012 and 2016 Republicans lost, relatively to the average town, in upscale towns like Hanover, Bedford, New Castle, Amherst, Hollis, and New London (most of these are strongly Republican towns, but Hanover is the most Democratic town in the state). Meanwhile, Republicans gained in the small towns of the North Country, places like Landaff, Berlin, Northumberland, and Millsfield. Libertarians (not necessarily Libertarian Party, but libertarianish candidates) look to have gained in western Hillsborough County, towns like Greenville, Mason, and New Ipswich (all heavily GOP). Again, this pattern really reflects the strength of Republican Frank Edelblut in his primary.
