In part two of this miniseries (part one here), I bring together different indicators of libertarian political support at the state level in order to estimate the size of the libertarian bloc in each state. In addition, the method I use to bring these indicators together will tell us two things: 1) Is state-level libertarianism a valid concept, or are we just picking up random noise? In other words, can we discern consistent patterns in the data that are best interpreted as reflecting libertarian ideology in state populations? 2) Which of the different indicators of libertarianism is most and least reliable?
The first of these is an important point. State politics scholars have often studied “opinion liberalism-conservatism” in state electorates and have shown that popular ideology influences state policies. I am not aware of any previous study that has looked at opinion libertarianism-populism at the state level before (and nothing peer-reviewed at the national level either!). If we can find, in real data on mass political behavior, that opinion libertarianism can be distinguished from, say, conservatism, that will be a real advance, something no one has demonstrated before.
The second of the things I hope to learn from this exercise could also be important, as it may show us how to continue to measure the size of the libertarian constituency, even after unique events such as the Ron Paul candidacy have passed and even without state-level survey data.
The method I use is principal component analysis (PCA), which is related to the factor analysis often used by psychologists to explore the dimensions of human intellect or personality. PCA chooses the best linear representations of a combination of variables, that is, the “common elements” that minimize the sum of squared errors across variables. The procedure can tell us the dimensionality of a set of variables, that is, how the common variance among the variables in this set can be reduced to a smaller set of variables. These latter variables, the dimensions underlying the dataset as a whole, are completely uncorrelated with each other. The way PCA works is by extracting the first component, which explains the most variance, then choosing the next component based on how well it explains the remaining variance after the first component is taken – and so on.
To see whether libertarian constituency exists as a concept and is distinct from mere liberalism-conservatism, I run PCA on eight variables: the adjusted Ron Paul vote share described in my last post, the number of Ron Paul donors per state, Libertarian Party vote in the 2008 presidential election, the mean LP vote share in the 1996-2004 presidential elections, an indicator of citizen opinion liberalism based on survey data from Berry et al., the Berry et al. measure of government opinion liberalism (based on surveys of state legislators), the Democrat/Green/Nader/minor socialist party vote share in the 2008 presidential election, and the mean Democrat/Green/Nader/minor socialist party vote share in the 1996-2004 elections. I expect the first four variables to load onto a single component, to be interpreted as “size of libertarian constituency,” while the latter four variables should load onto another component, to be interpreted as “size of liberal constituency.”
Here are the results of the PCA:
. pca lp08 donors rpcons2 lpvote citi6006 inst6006 demgrvote demgr08 [aweight=lnpop]
(sum of wgt is 7.5674e+02)
(obs=50)
(principal components; 8 components retained)
Component Eigenvalue Difference Proportion Cumulative
————————————————————–
1 3.58679 1.63772 0.4483 0.4483
2 1.94907 1.01805 0.2436 0.6920
3 0.93102 0.39043 0.1164 0.8084
The results show that two and only two components can explain the covariance of these eight variables.
Eigenvectors
Variable | 1 2
———-+———————–
lp08 | -0.26730 0.41529
donors | -0.19594 0.55189
rpcons2 | 0.02690 0.43189
lpvote | -0.22137 0.45861
citi6006 | 0.47376 0.16200
inst6006 | 0.40256 0.14078
demgrvote | 0.49388 0.11632
demgr08 | 0.45828 0.25789
And what do you know? The first component, liberalism, tracks the latter four variables, while the second component, libertarianism, tracks the first four. What we have here is evidence that libertarian constituency is a Real Thing, distinct from liberalism-conservatism, and can be discovered in election results and donation statistics. Again, by construction the PCA extracts totally uncorrelated components. As a result, all of the variables load at least a little bit onto all of the components. To get a cleaner indicator of libertarianism, we can just take the first four variables and run a PCA on them, and do the same on the last four variables to get a cleaner indicator of liberalism. Here are the results:
Eigenvectors
Variable | 1
————-+————-
lp08 | 0.52354
donors | 0.58063
rpcons2 | 0.29841
lpvote | 0.54747
Eigenvectors
Variable | 1
————-+————-
citi6006 | 0.51624
inst6006 | 0.43417
demgrvote | 0.52494
demgr08 | 0.51907
So what we see here is that Ron Paul’s primary vote share, although it contributes something to the libertarianism component, is not a very reliable indicator on its own. Encouragingly, LP vote share in different elections is a reliable indicator – that’s something we can use in the future. Both 2008 numbers and 1996-2004 numbers contribute equally. The reason for that is that these numbers jump around from election to election based on idiosyncratic factors. For the liberalism indicator, each variable contributes about as much, but the one variable least directly tied to citizen political behavior, government ideology, is the least reliable indicator on its own.
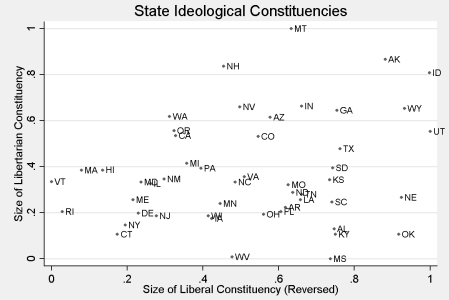
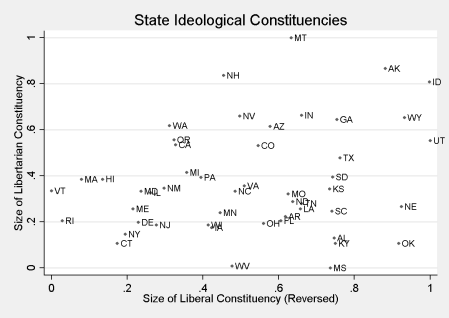
So…drumroll please… Which states have the biggest libertarian constituencies? I’ve chosen to present the results in a chart, plotting libertarianism against liberalism, which has been reversed so that higher values represent smaller liberal constituencies and – effectively – larger conservative ones. The chart thus maps perfectly onto the Nolan Chart conceptualization of the political spectrum. Click the graph below for a bigger image.
These data seem to pass the “smell test.” Idaho, Utah, Wyoming, Nebraska, Oklahoma, and Alaska are the most conservative states, while Vermont, Rhode Island, Massachusetts, Hawaii, Connecticut, and New York are the most liberal states. The states with the most libertarians are Montana, Alaska, New Hampshire, and Idaho, with Nevada, Indiana, Georgia, Wyoming, Washington, Oregon, Utah, California, and Colorado following. (The Georgia result is due in large part to Neal Boortz, incidentally, which becomes apparent if you track the presidential results over time.) There is a slight positive correlation between states with fewer liberals and those with more libertarians.
Note that New Hampshire’s result is affected by the migration due to the Free State Project. Since only about 600 people have moved, however, I don’t think the FSP has affected their position dramatically. However, in separate research, I have found that New Hampshire towns with each additional Free Stater who had moved in gave two more votes to Ron Paul in the 2008 primary. Thus, Free Staters have had influence beyond their numbers. However, they (we) still have a way to go to catch up to Montana(*).
Now that we know libertarians actually exist in the general population in measurable numbers (although we still can’t put absolute figures down – those who vote LP are surely a subset of actual libertarian and libertarian-leaning voters), do libertarians actually influence politics? Are they so minuscule that they have no effect, or – consistent with the hypothesis that LP and Ron Paul voters are just the thin end of the tail of an ideological distribution – do they actually influence the overall policy regime of a state? This question will be answered in Part 3 of the series.
(*)Montana’s a bit odd, because in 2008 the Constitution Party put Ron Paul on their ballot in Montana, and he got more than 2% of the vote. I counted half of that toward the libertarian vote.


Jason, does your analysis suggest that libertarianism is a Real Thing more than conservatism is?
We have heard Grover Cleveland and others talk about the “futility” of the left/right political spectrum. Perhaps part of the reason that spectrum is not particularly probative is that people slide back and forth along it. So “conservative,” for example, is a moving target, with people identifying themselves with it or not as fashion, circumstances, and hipness (don’t ever forget the hipness factor) change. I suspect the same might be true for “liberal.”
So that makes me wonder whether there is less emanation from the core of libertarians than there might be from the core conservatives or liberals. Thus there might be a higher proportion of hard-core to hangers-on among libertarians than among other positions. If so, the numbers we hear purporting to identify the proportion of citizens that are conservative or liberal are less “real” than the (admittedly smaller) numbers identifying libertarians.
What do you think?
Interesting comments that bring up a number of issues. The first issue is how people label themselves. There is certainly a lot of variability over time in the proportion of people labeling themselves “conservative,” “moderate,” “liberal,” and “libertarian.” Few polls give “libertarian” as an option, so we know less about how that self-identification changes over time. What we do know is that most libertarian-ish voters don’t call themselves “libertarian.” Something like 2-3% of the electorate self-identifies as libertarian, while Boaz & Kirby have found that about 15% of the electorate could be considered libertarian, judging from survey results. I think “liberal” is similar: more people actually are liberal than claim to be – while “conservative” is the opposite: a good 40% of Americans claim to be conservative.
So labels don’t mean too much – what matters more are policy positions. There’s a well-known phenomenon called “partisan rationalization” that has been verified in controlled experiments. What it means is that people’s partisan identifications are fundamental to their personal identities, and their policy positions tend to flow from their partisan ID, rather than the other way around. This finding certainly implies that “conservatism” and “liberalism,” defined as sets of policy positions, could be moving targets that evolve as national party positions evolve. Trade is a good example – conservative Republicans used to be protectionists and liberal Democrats free-traders, but the opposite generalization is now true.
We know from the Boaz & Kirby stuff that libertarians are not strong partisan identifiers: they voted mostly for Bush in 2000, were split in 2004, and voted mostly for Obama in 2008. And of course some libertarians vote Libertarian or don’t vote at all. While no studies have been done on whether libertarians also engage in partisan rationalization, I would hypothesize that they do not to the degree that strong Republicans and Democrats do. So in short, I agree that it seems likely that libertarianism, as a set of points in political space, probably has more fixity than conservatism and liberalism. But we don’t have any direct evidence of this yet.
We know from the Boaz & Kirby stuff that libertarians are not strong partisan identifiers: they voted mostly for Bush in 2000, were split in 2004, and voted mostly for Obama in 2008.
I need to correct this – Boaz & Kirby actually found that libertarians returned more to the Republican camp in 2008; however, there was a generational gap. Young libertarians went for Obama, but older libertarians went strongly for McCain.
I’m guessing those younger ones might not be so happy right now. However, McCain’s foreign policy ideas weren’t all that compelling – so maybe they’d still make the same decision if they were the marginal voters. But I doubt it (even though a McCain presidency would not have been a picnic for folks like us).